|
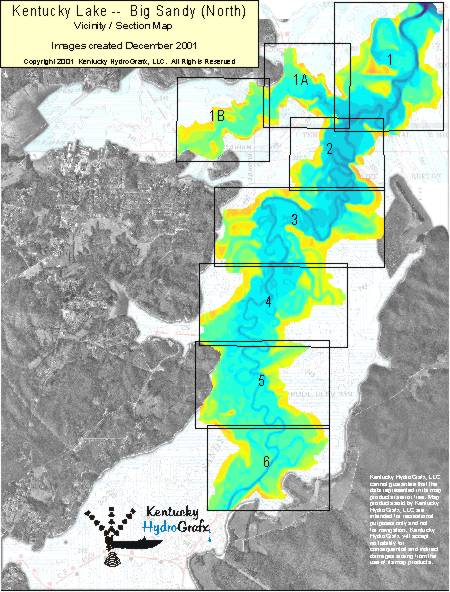
The area in color on the left is the portion of the Big Sandy River and Eagle Creek Embayments that have been re-mapped.NEW depth data was collected from September - December of 2001.The new maps extend from the junction of the Big Sandy River and Tennessee River to just north of a major power line crossing the bay to the south.The high resolution imagery for Big Sandy is based on over 185,000 depth readings covering more than 2400 acres. This is by far the largest area re-surveyed by Kentucky HydroGrafx to date.The bay is divided into 8 sections. Topographic images for each section contain a contour interval of 1.0 or 2.0 ft.As you see here, the images are actually a hybrid image including the brand new data, plus background imagery of Charts 113 & 104. Also included in the background is aerial photography to help get oriented with real world features. |
Topographic images on CD each contain a latitude and longitude grid and coordinates for easy calibration with GPS mapping software.
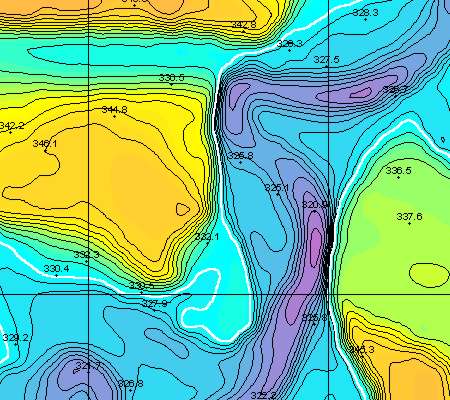 |
This is a sample from Section 1 just below the center of that section.The image here is somewhat distorted by compression to minimize download time for this page. The image you receive has no distortion.Latitude/Longitude grid lines are provide on the topo maps for easy calibration with GPS mapping software.The contour interval is 1.0 foot below the white contour line and 2.0 feet above the same white line. This is done to reduce stacked contours on steep slopes but showing as much detail as possible on more gentle slopes.Hundreds of spot elevations are included on all section maps for easy reference. If you know the current lake elevation, then water depth can be easily calculated. |
The next step in 3d viewing has been included in all high resolution Big Sandy Images
|
An improved 3d imaging technique has been used to produce the Big Sandy 3d images.The same high resolution topographic images have been "draped" over the digital elevation model created by Kentucky HydroGrafx. The shading effect of artificial sunlight on the model helps our brain comprehend the elevation changes. The summer pool level of 359ft is represented on non-surveyed edges as the blue/green color you see here.To see the near future in 3d images produced by KY HydroGrafx, go back to the home page and brush your mouse pointer across the "3d Lake Terrain Imaging" button. |
Other images included on the CD (not shown here) for Big Sandy include: |
Large scale image of all re-surveyed map sections with aerial and chart backgroundClips of scanned charts 104 and 113 covering from just north of the Hwy 79 bridge south to Mansard Island.High Resolution hybrid image of aerial photography with embedded charts 104 and 113A DEMO version of OziExplorer GPS Mapping software is provided on disk to get you started with precision fishing. The HydroGrafx images work flawlessly with this version. |
Copyright 2001 Kentucky HydroGrafx, LLC, A Kentucky Limited Liability Company.
