Index

SIDESCAN Series
Kentucky Lake Northeast SS

Bays in this set include Smith, Duncan, Sugar,
Higgins, Rhodes, Savells, Vickers and Barnett.

To See more image clips of this new Sidescan Series, CLICK HERE

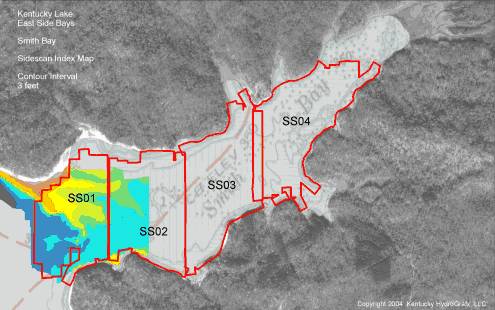
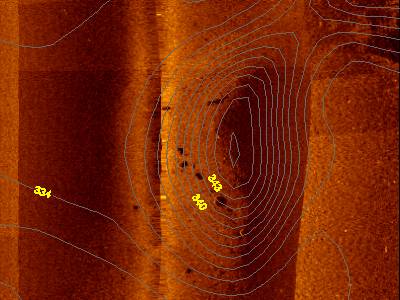
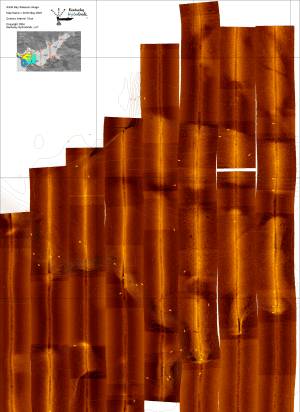
This is a zoomed out image of one sidescan section for Smith Bay. While the image detail is not useful at this range, all the structure secrets become readily apparent at the optimum zoom range. See below for a few examples.

This is called a "sidescan mosaic" which represents multiple sidescan passes parallel to each other. While every effort is made to make the nicest image possible, sidescan imagery contains a few artifacts that cannot be avoided.

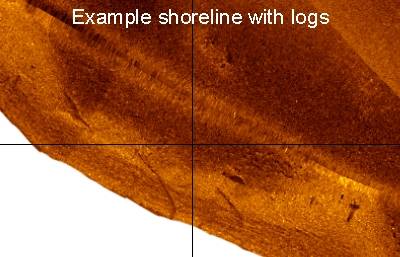
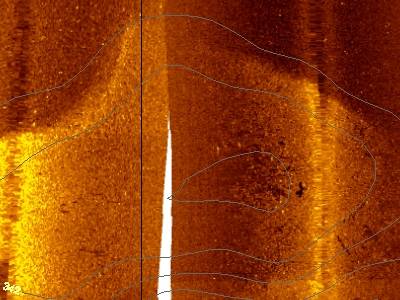
A special sidescan image is provided on disk that includes examples of typical objects and terrain features found in the lakes.

Once you get oriented to some of the most unique lake terrain imagery, you could actually become an experienced sidescan interpreter.

All Sidescan imagery is georeferenced just like conventional HydroGrafx maps.

The bays have been sidescanned well beyond the high resolution topo zones to reveal as much structure information as possible.

Each Bay is divided into sections to minimize file sizes.

Index maps are provided for each bay to help with orientation.


This is a full resolution clip from Section SS01 in Smith Bay. This is a hump that has what appear to be stumps on the western face.

Note the contours faintly overlayed on the image to provide elevation information.

The fuzzy line just left of the hump is the centerline of the sidescan pass.

One pass is approximately 200 feet in width, so this hump is nearly 125 feet wide.

This image represents approximately 3 acres. This set includes nearly 1800 acres of sidescan data.


This is a shoreline scan from Duncan Bay. There are 4 or 5 logs showing, with the smallest partially suspended off the bottom of the lake. A few other objects are in the image as well.

Shorelines were scanned where possible to reveal an unbelievable amount of logs and other structure. You may be surprised to see how far from the shoreline natural logs exist.


Not only can sidescan reveal objects on the bottom, but it will show relative changes in bottom hardness or substrate composition.

Here you see a slight hump in Sugar Bay. The lighter/yellow color represent a harder bottom or stronger sonar return.

The contour interval is 1 foot, so the actual elevation change would be very subtle. Notice the objects on the right center part of the hump. Objects cast sonic shadows as if a light was shining on it at a low angle.


Other items included on the CD
(not shown here) include:

A very functional shareware version of OziExplorer GPS Mapping software is provided on disk to get you started with precision fishing. The HydroGrafx images work flawlessly with this version.


Click Here to Purchase

Home Page

If you have any questions about this product, you can email us here pdghahs@kentuckyhydrografx.com

Copyright 2004 Kentucky HydroGrafx, LLC, A Kentucky Limited Liability Company.